CAPITAL
| Table 1: Capital | ||||
Survey of Expected Loss by Risk Grade (bps) |
||||
AA |
A |
BB |
B |
|
3-year |
3-year |
3-year |
3-year |
|
Low |
0.9 |
2.0 |
4.0 |
18.0 |
Average |
1.9 |
5.1 |
11.0 |
44.0 |
High |
5.0 |
10.0 |
17.0 |
84.0 |
| * Senior, 3yr- Unsecured bullet maturity Facilities source: First Manhattan Consulting Group, RMA, "Winning the Credit Cycle Game: A Road Map for Adding Shareholder Value Through Credit Portfolio Managment". |
||||
| Table 2: Capital | ||||
Survey of Capital Ratios by Risk Grade (bps) |
||||
AA |
A |
BB |
B |
|
3-year |
3-year |
3-year |
3-year |
|
Low |
21 |
35 |
50 |
185 |
Average |
78 |
132 |
196 |
444 |
High |
120 |
240 |
364 |
700 |
| *
Senior, 3-yr Unsecured Bullet Maturity Facilities source: First Manhattan Consulting Group, RMA, "Winning the Credit Cycle Game: A Road Map for Adding Shareholder Value Through Credit Portfolio Managment". |
||||
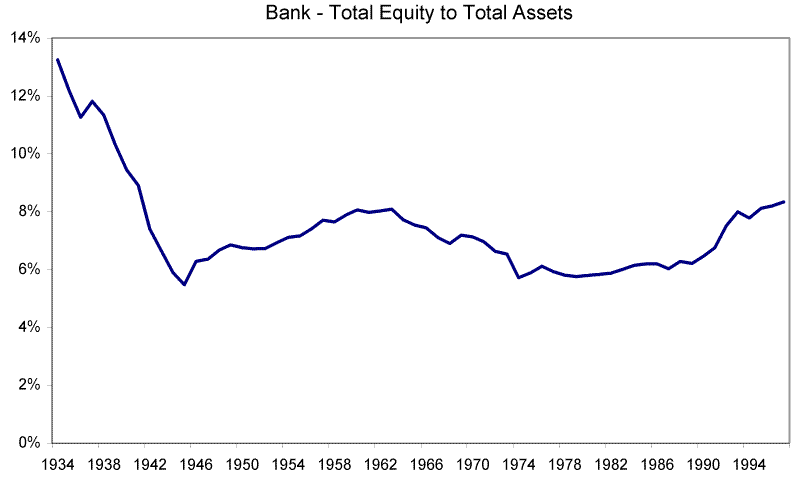
Chart 2: Capital

source: www.FDIC.gov ,The Federal Deposit Insurance
Corporation - Division of Research and Statistics. "Historical Statistics on
Banking".
Chart 3: Capital

source: Bloomberg L.P. 1999.
Chart 4: Capital

source:
Chart 5: Capital

source: author's calculations
Source: Financial Services at the Crossroads: Capital Regulation in the Twenty First Century, February 26-7, 1998
Capital Allocation and Bank Management Based on the Quantification of Credit Risk
Chart 7: Capital

source: Bloomberg L.P.,1999. Standard & Poor's CreditWeek: The Global
Authority on Credit Quality; global Defaults Remain Low, 1/28/98.
Note: Spreads are as of 3/1/99
Chart 8: Capital

source: Caouette, John B., and Altman, Edward I., and Narayanan, Paul, Managing
Credit Risk: The Next Great Financial Challenge, John Wiley & Sons, copyright
1998, Moody's Investors Service 1991, 12.
source
Chart 10: Capital

Chart 11: Capital

The marginal addition from volatility assumes independent risk, and uses the formula
![]()

