Capital Priorities: Practical Advice on Implementing RAROC
by Eric Falkenstein
©1999 by RMA. Falkenstein is SVP, Capital Allocations and Quantitative Analysis, KeyCorp, Cleveland, Ohio.
In the good old days of 3-6-3 banking, return on assets (ROA) implied a unique return on equity (ROE). With securitization, credit derivatives, and competition from nonbanks, this just is not a workable assumption anymore. RAROC (risk-adjusted return on capital) has become a buzzword for more rational performance evaluation—one that looks at capital as a function of risk and not regulators—and matching this with return. While only a troglodyte would be against the move to enterprise-wide RAROC in theory, in practice implementation is going very slowly. Clearly, RAROC is not an off-the-shelf technology one can apply but a complicated set of rules that needs to be calibrated for each bank’s unique set of products, incentive compensation plans, pricing models, and most importantly, information systems.
PDFs and the Search for Unexpected Loss
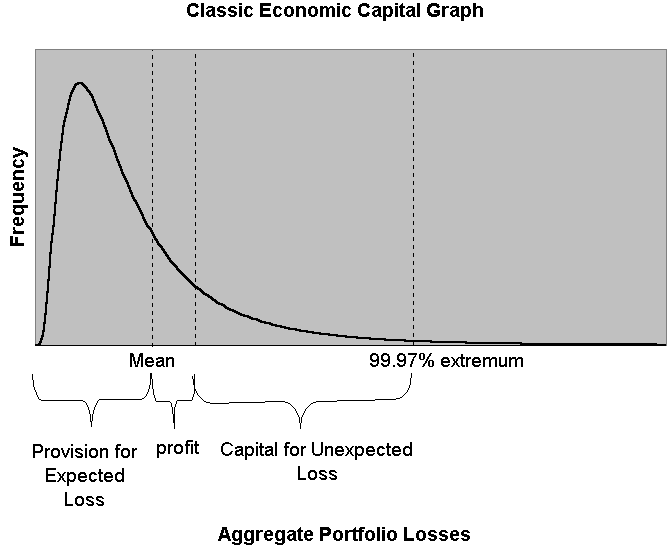
Most discussion of capital centers on the concept of expected and unexpected loss. Figure 1 portrays the classic picture of expected and unexpected loss using a probability density function (PDF). For those whose working knowledge of statistics is rusty, PDF is simply a continuous limit of a histogram, in which the area under the curve represents the relative probability of getting to a particular area. Expected losses should be incorporated into pricing through a "provision" and should represent the expected loss over the long term, assuming next year is neither above nor below average. For example, if commercial real estate loses 10% once every 10 years, and 0% the other nine, its provision is 1%. The unexpected loss is the loss in the worst-case scenario—more specifically, the difference of this loss to the mean. If this were a 90% worst-case scenario, the capital assessed would be 9%.
In this view capital represents the amount needed as a cushion for hard times. The next step would be to determine that if the one-year probability of default for a target debt rating is 0.03%, as it is for AA-rated companies, then the bank-wide capital should go to a 99.97% worst-case scenario. The target debt rating is reconciled with true economic risk.
Indiscriminate consistency is the hobgoblin of small minds. In this case, it would be foolish to be taken in by any seeming precision found in the above exercise. With everything consistent to the hundredth of a percent, the CFO would probably wear a white lab coat. Such an image only hurts the implementation, as inevitable ad-hoc adjustments are then seen as totally at variance with the scientific method that RAROC is supposed to represent. Just as aerodynamic engineers are always adjusting designs initially, based on differential equations, real-life capital allocation is ultimately a patchwork of seemingly simple rules shaped by theory and experience.
PDFs are neither Bottom-Up nor Top-Down
Traditionally, the PDF of the portfolio is modeled using a "bottom-up" approach to reveal the appropriate extreme. This approach1, however, is not really bottom-up, since it assumes that correlations, volatility, and, most important, mean loss rates are given. It’s more like a "mezzanine-level" model—not top-down, but certainly not bottom-up.2 The approach receives high visibility due to its ability to analyze the high-profile credits, such as portfolios or structured securities that include rated debt.
A recent conference on capital regulation sponsored by the Federal Reserve of New York seemed oblivious to the credit risk from obligors outside the Fortune 500.3 Some theories actually require prices of traded debt when estimating risk4, while less demanding ones only require current equity values and historical stock variability.5 There’s a place for this type of analysis, but it’s not in banking. For borrowers large enough to receive Standard & Poor’s or Moody’s ratings, or even just to have equity listed on an exchange, banks are not in a special competitive position relative to nonbanks. While large agency-rated corporations do have bank loans, these are increasingly syndicated, and by putting these in the "trading book" as opposed to the "bank book," capital allocation equals credit value-at-risk (VaR) for both economic and regulatory requirements. Thus, for bankers and regulators, risk measurement and capital allocation for these large, rated loans is reducing quickly to a problem already solved. Is this the way all assets should be modeled, even if you can’t put them in the trading book?
A Practical, versus Sexy, Focus
Customers that do not come with a validated, independent debt rating stamped on their forehead should not be modeled as if they did. There is a big difference between the debt from Exxon and that from Wally’s Widget World. Making the assumption that Wally’s has a rating and modeling it like Exxon is not simply working through the problem back to front—it is wrong. Take the following example. A home equity loan can be thought of as a loan secured by an asset. Assuming the asset is like an equity security, its value is lognormally distributed. The expected loss can be estimated by using the Black-Scholes option equation, using as inputs the maturity of the loan, the risk-free rate, the value of the loan, the house’s value, and the volatility of the house’s value. Yet this elegant approach is far deficient to segregating the portfolio by first or second lien, loan to value, and bureau score, and then estimating future losses based on historical loss curves. This latter approach is not based on any Nobel prize-winning work but, done correctly, it can work better than anything else.
PDFs are to RAROC as Parisian couture is to everyday fashion: leading edge, but far removed and over-hyped. Less sexy and more practical wear is of much greater importance to the vast majority of bankers. In that regard, expected losses, validated and with many different pass grades, are the most important risk measures a banker can know. It is important for pricing directly, in that net spreads and not gross spreads are what count over time. Further, in practice capital allocations are drawn from simple functions based on expected loss by product type. These functions can be constructed using market data, such as corporate spreads, asset backed security data, and historical loss statistics, but ultimately the expected loss remains the key input to the whole process.
It often is better to aim for an intermediate target rather than targeting the ultimate objective itself. The capital estimate will eventually be the result of an iterative process of trial and error, based on historical data, current market prices, theory, and intuition—reconciled with data limitations and how capital interacts with its various applications to pricing, incentive compensation, and performance evaluation. It will take at least a year from inception to implementation as one adjusts not only capital, but the processes affected by capital in light of the new approach. This is invariably a slow process, requiring many meetings. In the meantime, it’s essential to validate the expected loss information that feeds the approach. For most products, most banks do not validate these risk measures.
Validation of Assumptions is Key
Information that bankers traditionally produce on asset quality includes the percentage of classified loans, the distribution of risk grades including a mapping into S&P grades, consumer scorecard good/bad odds, and policy exception reporting. Such information is only meaningful if grades, scores, and policy exceptions correlate with charge-offs in an anticipated magnitude. The first realization in an enterprise-wide RAROC project, however, is that validation of the underlying assumptions is not possible in many areas. Commercial lending is especially problematic because there are few, if any, new charge-offs in good times; thus, risky and nonrisky portfolios are observationally equivalent. Since the last recession was almost 10 years ago, given mergers and systems upgrades, very few commercial LOBs have a track record for current internal pass grades that can be validated.
This inability to validate track records does not imply that most internal grading systems are bogus. It simply means that poorly calibrated commercial grading systems can look just like well-calibrated risk models if one just focuses on total charge-offs. Just as a bull market makes most investors appear smart, an expansion makes most bankers appear prudent. Low losses for a business line over the past several years reveals very little about the relative riskiness of that portfolio. How does one prepare for the Big One before it arrives?
A better benchmark for RAROC implementers is consumer scorecard validation, not VaR. The emphasis should be on cross-sectional risk rankings. With many loans and a weak definition of "bad" (say, moving down to criticized status just once), it’s possible to cross-sectionally validate internal pass grades over only one year. This cross-sectional information can then be tied to top-down information from historical charge-offs into expected losses. This is an iterative process that, among other things, involves backtesting a model, seeing what other data are available for the next version, and using prospective performance to get true out-of-sample results.
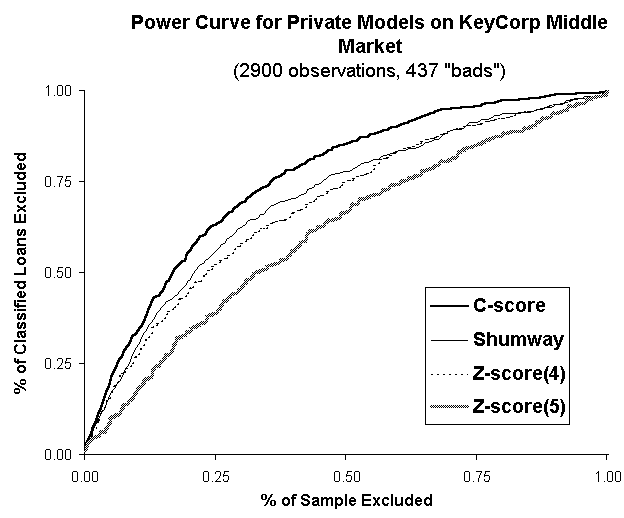
KeyCorp’s C-Score Model
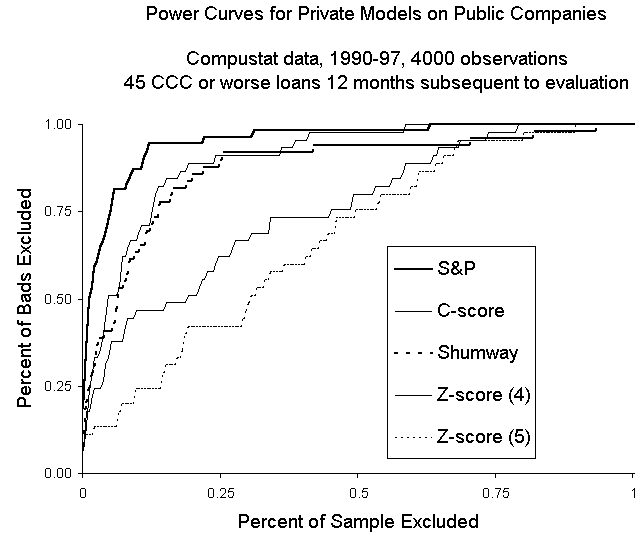
The model of commercial lending developed for KeyCorp is called "C-Score."6 The name comes from the fact that KeyCorp is in Cleveland, and the benchmark in this field is Altman’s Z-score.7 Its essence was distilled from examining publicly traded companies, using a "cost minimization" algorithm that ultimately ended up as ordinary least squares applied to a transformation on the S&P debt-rating. S&P isn’t always right, but because only 15% of companies change ratings each year and bond price moves tend to lead S&P changes by only six months, it is logical to assume that S&P ratings are right for 85% of publicly traded bonds and only six months off for the other 15%. While this logic is not perfect, the approach is much better than trying to extract patterns from a handful of defaults (for example, approximately 5,000 firm-years with only 65 observations below B-).
The results using KeyCorp and Compustat data are portrayed in Figures 2 and 3. The two graphs demonstrate C-score’s performance using a power curve. A higher curve is better because it means that the model in question excludes more "bads" more quickly. A random model eliminates 50% of the bads by eliminating 50% of the sample. A better-than-random model would eliminate 75% of the bads by eliminating 50% of the sample, and this point would be above the 45-degree line produced by a random model.
Comparing Models
For public companies, the two versions of Altman’s Z-score are by far the worst. Tyler Shumway has a model that performs appreciably better and the C-score performs slightly better still; above the C-score are S&P ratings themselves (any model that just uses financial statements should not expect to do better than the S&P, but it is a useful benchmark just the same).8 On its targeted asset class, internal middle-market data, the C-score strictly dominates alternatives, with the Z-score again bringing up the rear. Shumway’s model falters here because it actually contains a negative coefficient on the current ratio. That is, higher the current ratio, lower the risk rating. This statistical anomaly comes from a relationship that really exists for public companies. For large companies with many channels for raising funds, a high current ratio is more a sign of incompetent cash management than prudence. That relationship does not exist, however, for smaller companies that cannot tap the direct lending market. Shumway’s model highlights the troubles of naively applying a model without making reasonable adjustments for the portfolio at hand—in this case, middle-market as opposed to large corporate obligors. Altman's model highlights the importance of keeping a model up to date: Credit models are not physics equations and need to change as financial innovation and accounting concepts change.
KeyCorp also developed a model for large, publicly traded companies. While it’s possible to apply a model that only uses financial ratios to publicly traded firms, it is clearly less effective than a model that uses information from market equity and, when available, debt ratings from S&P or Moody’s.9 The exciting thing about this modeling is that it adds discipline to the exercise, as it provides another point of reference to calibrate expected loss and capital. By monitoring other market data we can calibrate a capital model from the very bottom (obligor and facility information) to the very top (asset backed securitization data).
Never Ending Process
One of the great advantages to capital modeling is its ability to highlight blind spots in current risk management practices. VaR operates in the same way; its greatest value is not in a number that can be used for strategy but, instead, in what a validated number implies about the models and systems that underlie it. RAROC breathes new life into a financial reporting and risk management process that too often is satisfied with meaningless reports precisely because these reports are not then tied into a measure with real impact.
Why would KeyCorp share a model that has proven to be a world-beater? Because while sharing the model may help other banks as they consider approaches to commercial credit modeling, it does not give away KeyCorp’s competitive advantage. Any base model is just the start, and as the Red Queen said in Alice in Wonderland, you’ve got to keep running just to stay in the same place. There is no competitive advantage in taking risk measures off the shelf without adjustment, and while a black box may allow a group to keep its head above water in good times, the odds will sour quickly when turbulence arises.
The top priorities in allocating capital within a bank are in building databases capable of calibrating and validating internal risk grades, not using mezzanine-level modeling of portfolio variability. LikeY2K validation, what at first seems like a straightforward problem metastasizes into a multiheaded monster, and in between meetings with various other groups in your bank, it is useful to remember that it all starts with validated expected loss forecasts.
It would be nice if all banks had comprehensive, archival, transaction-level databases that tie together application, accounting, and recovery information. It would be nice if internal pass grades and capital estimation algorithms did not need to be developed through intelligent trial and error, and instead could be lifted ready-made from outside the bank. It would be nice if capital allocations could be implemented irrespective of existing pricing models and incentive compensation plans. Yet just as virtue is admired precisely because it is not easily acquired, RAROC offers a competitive advantage precisely because it is difficult to implement. Models not jerry-built by users are either being used suboptimally or ignored. Making adjustments to a model based on keen insights from the business line creates a positive feedback loop of better risk measures creating, in turn, more informed personnel who develop better risk measures, better pricing, and better marketing campaigns.
NOTES
1 For example, the credit VaR approaches of CreditMetrics, CreditRisk+, CreditPortfolioView
2 The top down approach is a workable intermediate step, but ultimately a bottom up approach is preferred since in this case there is no bias towards loading up on the highest yielding but riskiest assets in any particular line of business.
2 Financial Services at the Crossroads: Capital Regulation in the Twenty-First Century, Federal Reserve Bank of New York, February 26-27, 1998.
3 Jarrow and Turnbull, A Unified Approach for Pricing Contingent Claims on Multiple Term Structures, Review of Quantitative Finance and Accounting, (10) 1998, 5-19.
4 This approach is best popularized by KMV. See Oldrich A. Vasicek, Credit Valuation, NetExposure, Issue 1, 10/97.
5 The details of the model can be found at the author’s Web site—www.efalken.com/banking—including an explicit rendering of the base middle-market (or private) model.
6 See Altman, Corporate Financial Distress and Bankruptcy, 1993, John Wiley and Sons, p. 203-5.
7 Shumway, Forecasting Bankruptcy More Accurately: A Simple Hazard Model, working paper. Downloadable at www-personal.umich.edu/~shumway
6 Proprietary (that is, no explicit function form) C-scores for public companies also are available on at www.efalken.com/banking, and the author is confident that these scores outperform all alternatives.