Correlations
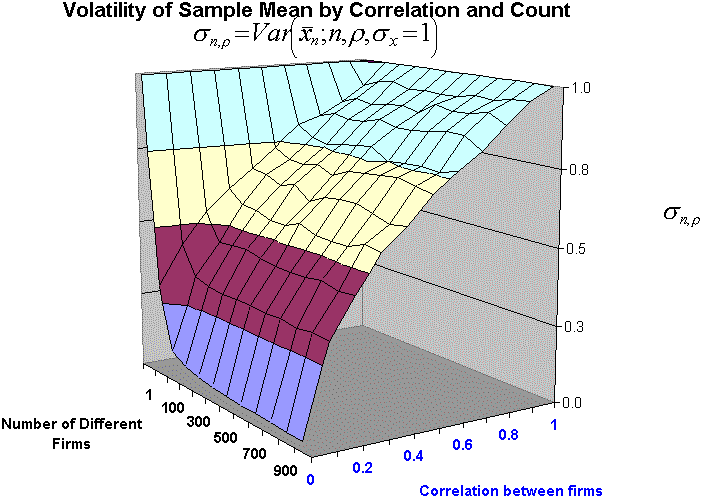
| Chart 1: Portfolio Correlation by count and within-group Correlation |
| Chart 2: Credit Card Charge-offs |
| Chart 3: NIM vs Bank Stock Index Returns |
| Chart 4: Loan Charge-Offs vs Bank Stock Index |
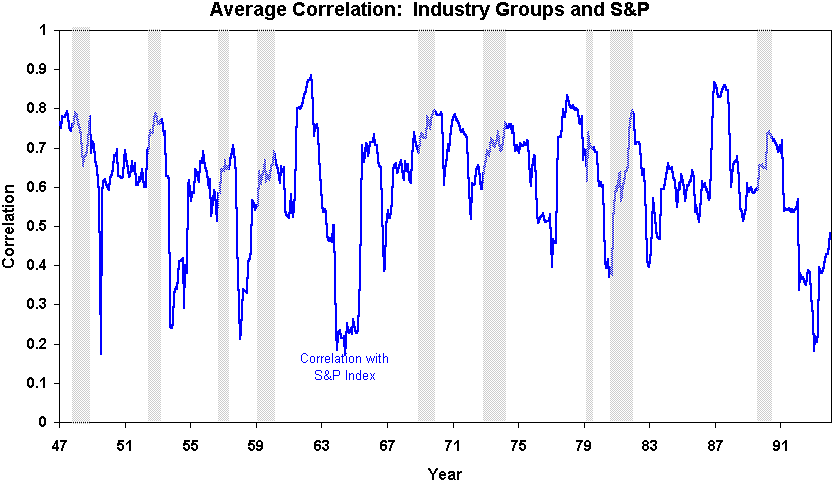
| Chart 5: Average Correlation: Industry Groups & S&P |
| Chart 6: Correlation Between Industry Groups & S&P Index |
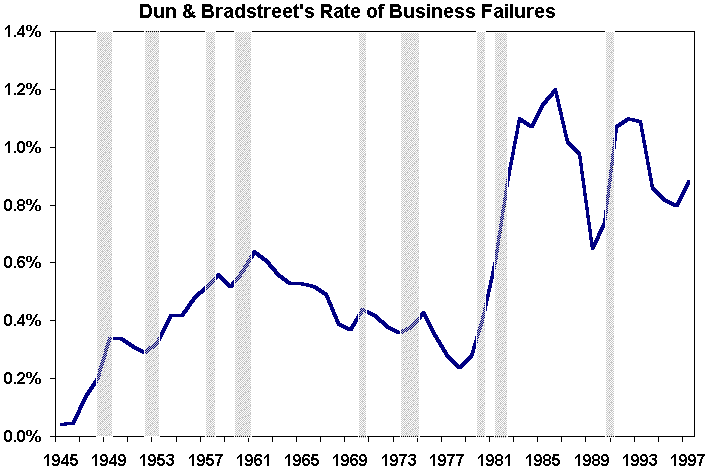
| Chart 7: Dun & Bradstreet's Rate of Business Failures |
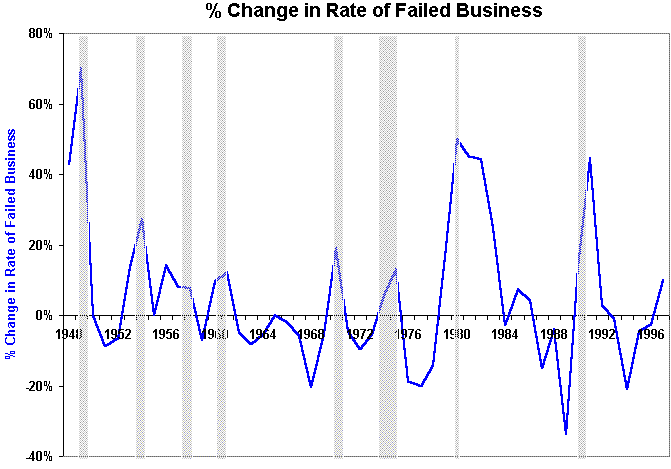
| Chart 8: % Change in Rate of Failed Business |
| Chart 9: D&B Failure Rates by Industry |
| Chart 10: Qtrly Returns: Bank Index vs Shearson Lehman Aggregate vs Merrill Lynch High Yield |
| Chart 11: Baa-Aaa Spread as a % of the 5 Yr Treasury Yield |

source: Professor Ausubel, Lawrence M.,
University of Maryland Dept. of Economics, 1995, "The Credit Card Market
Revisited", Federal Reserve Bank of San Francisco Economic
Letter, Western Banking Quarterly (www.SF.FRB.ORG)
Chart
3: Correlations
source: The Dun
& Bradstreet Corporation, "Business Failure Record: A comparative statistical
analysis of geographic and industry trends in business failures in the United States,
Final:1996, Preliminary: 1997".(Bloomberg L.P.?)
Chart 4: Correlations
source: The Dun
& Bradstreet Corporation, "Business Failure Record: A comparative statistical
analysis of geographic and industry trends in business failures in the United States,
Final:1996, Preliminary: 1997". (Bloomberg L.P. ?)
Chart 5:Correlations

Source:
Chart 6: Correlations
source:
Chart 7: Correlations

source: The
Dun & Bradstreet Corporation, "Business Failure Record: A comparative statistical
analysis of geographic and industry trends in business failures in the United States,
Final:1996, Preliminary: 1997". (Bloomberg L.P. ?)
Chart 8: Correlations

source: The Dun
& Bradstreet Corporation, "Business Failure Record: A comparative statistical
analysis of geographic and industry trends in business failures in the United States,
Final:1996, Preliminary: 1997". (Bloomberg L.P. ?)
Chart 9: Correlations

Chart 10: Correlations

source: Bloomberg L.P., 1999.