Transition Matrices
One - Year Transition Matrices
| Table 1: Transition Matrices |
S&P's Average One-Year Rating Transition Matrix
1981-96 |
| Initial Rating |
Rating To (%): |
AAA |
AA |
A |
BBB |
BB |
B |
CCC |
D |
NR |
AAA |
88.46 |
8.05 |
0.72 |
0.06 |
0.11 |
0.00 |
0.00 |
0.00 |
2.61 |
AA |
0.63 |
88.27 |
7.47 |
0.56 |
0.05 |
0.13 |
0.02 |
0.00 |
2.87 |
A |
0.08 |
2.32 |
87.64 |
5.02 |
0.65 |
0.22 |
0.01 |
0.05 |
4.01 |
BBB |
0.03 |
0.29 |
5.54 |
82.49 |
4.68 |
1.02 |
0.11 |
0.17 |
5.67 |
BB |
0.02 |
0.11 |
0.58 |
7.01 |
73.83 |
7.64 |
0.89 |
0.98 |
8.93 |
B |
0.00 |
0.09 |
0.21 |
0.39 |
5.98 |
72.76 |
3.42 |
4.92 |
12.23 |
CCC |
0.17 |
0.00 |
0.34 |
1.02 |
2.20 |
9.64 |
53.13 |
19.29 |
14.21 |
| Source: Standard & Poor's Credit Analysis Service, 3/3/97,
"Corporate Defaults Slashed in 1996". |
| Table 2: Transition Matrices |
Moody's Average One-Year Rating Transition Matrix
1920-96 |
| Rating
From: |
Rating
To (%): |
Aaa |
Aa |
A |
Baa |
Ba |
B |
Caa-C |
Default |
WR |
Aaa |
88.32 |
6.15 |
0.99 |
0.23 |
0.02 |
0.00 |
0.00 |
0.00 |
4.29 |
Aa |
1.21 |
86.76 |
5.76 |
0.66 |
0.16 |
0.02 |
0.00 |
0.06 |
5.36 |
A |
0.07 |
2.30 |
86.09 |
4.67 |
0.63 |
0.10 |
0.02 |
0.12 |
5.99 |
Baa |
0.03 |
0.24 |
3.87 |
82.52 |
4.68 |
0.61 |
0.06 |
0.28 |
7.71 |
Ba |
0.01 |
0.08 |
0.39 |
4.61 |
79.03 |
4.96 |
0.41 |
1.11 |
9.39 |
B |
0.00 |
0.04 |
0.13 |
0.60 |
5.79 |
76.33 |
3.08 |
3.49 |
10.53 |
Caa-C |
0.00 |
0.02 |
0.04 |
0.34 |
1.26 |
5.29 |
71.87 |
12.41 |
8.78 |
| Source: Moody's
Investor Service, July, 1997, "Moody's Rating Migration and Credit Quality
Correlation". |
| Table 3: Transition Matrices |
KMV's One-Year Transition Matrices as Tabulated from Expected
Default Frequencies 1990-9/95 (EDFs) |
Initial
Rating |
Rating
at Year End (%) : |
1(AAA) |
2(AA) |
3(A) |
4(BBB) |
5(BB) |
6(B) |
7(CCC) |
8(Default) |
1(AAA) |
66.26 |
22.22 |
7.37 |
2.45 |
0.86 |
0.67 |
0.14 |
0.02 |
2(AA) |
21.66 |
43.04 |
25.83 |
6.56 |
1.99 |
0.68 |
0.20 |
0.04 |
3(A) |
2.76 |
20.34 |
44.19 |
22.94 |
7.42 |
1.97 |
0.28 |
0.10 |
4(BBB) |
0.30 |
2.80 |
22.63 |
42.54 |
23.52 |
6.95 |
1.00 |
0.26 |
5(BB) |
0.08 |
0.24 |
3.69 |
22.93 |
44.41 |
24.53 |
3.41 |
0.71 |
6(B) |
0.01 |
0.05 |
0.39 |
3.48 |
20.47 |
53.00 |
20.58 |
2.01 |
7(CCC) |
0.00 |
0.01 |
0.09 |
0.26 |
1.79 |
17.77 |
69.94 |
10.13 |
| Source: KMV
Corporation, as published in CREDITMETRICS - Technical Document, April 2, 1997,
"Default and Credit Quality Migration", pp. 70. |
Five - Year Transition Matrices
| Table 5: Transition Matrices |
S&P's Average Five-Year Rating Transition Matrix 1981-96 |
| Initial
Rating |
Rating
End of 5 Yrs (%) |
AAA |
AA |
A |
BBB |
BB |
B |
CCC |
D |
NR |
AAA |
54.02 |
23.45 |
6.04 |
1.70 |
0.54 |
0.23 |
0.00 |
0.23 |
13.78 |
AA |
2.38 |
53.40 |
24.36 |
4.06 |
0.89 |
0.76 |
1.00 |
0.39 |
13.66 |
A |
0.20 |
7.00 |
53.38 |
14.92 |
3.05 |
1.76 |
0.28 |
0.65 |
18.75 |
BBB |
0.20 |
1.30 |
15.52 |
41.52 |
9.63 |
3.35 |
0.83 |
1.95 |
25.70 |
BB |
0.11 |
0.42 |
2.85 |
13.85 |
19.94 |
9.58 |
1.66 |
11.42 |
40.17 |
B |
0.00 |
0.12 |
0.62 |
2.80 |
9.48 |
16.57 |
2.52 |
22.48 |
45.40 |
CCC |
0.22 |
0.00 |
0.87 |
2.39 |
3.47 |
6.07 |
5.42 |
42.08 |
39.48 |
| Source: Standard
& Poor's Credit Analysis Service, 3/3/97, "Corporate Defaults Slashed in
1996". |
| Table 6: Transition Matrices |
Moody's Average Five-Year Rating Transition Matrix 1920-92 |
| Initial
Rating |
Rating
End of 5 Yrs (%): |
Aaa |
Aa |
A |
Baa |
Ba |
B |
Caa-C |
Default |
WR |
Aaa |
60.78 |
15.21 |
4.33 |
0.96 |
0.49 |
0.09 |
0.03 |
0.14 |
17.96 |
Aa |
3.43 |
54.14 |
15.93 |
3.42 |
1.16 |
0.20 |
0.02 |
0.58 |
21.12 |
A |
0.20 |
5.85 |
55.74 |
10.34 |
2.58 |
0.69 |
0.08 |
1.08 |
23.43 |
Baa |
0.09 |
0.92 |
10.01 |
47.06 |
8.03 |
2.00 |
0.32 |
2.28 |
29.28 |
Ba |
0.04 |
0.26 |
1.92 |
10.40 |
36.48 |
8.09 |
1.29 |
5.90 |
35.62 |
B |
0.02 |
0.09 |
0.48 |
2.41 |
10.25 |
32.12 |
3.53 |
12.91 |
38.19 |
Caa-C |
0.00 |
0.00 |
0.02 |
1.57 |
4.03 |
7.77 |
29.60 |
27.98 |
29.04 |
| Source:
Moody's Investor Service, July, 1997, "Moody's Rating Migration and Credit Quality
Correlation". |
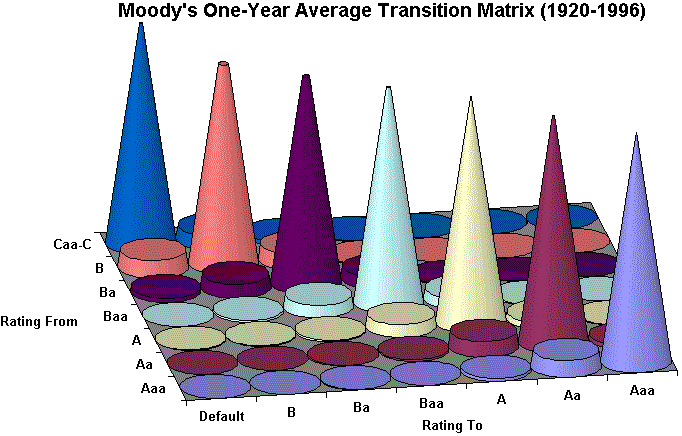
Chart 1: Transition

Source: Moody's Investor Service, July, 1997,
"Moody's Rating Migration and Credit Quality Correlation".
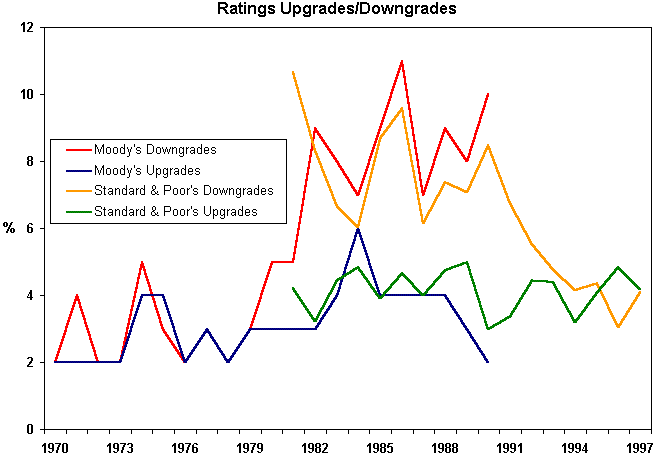
Chart 2: Transition

source: Moody's: Lucas, Douglas, and Lonski, John, The Journal of Fixed Income, March,
1992, "Changes in Corporate Credit Quality 1970-1990". Standard
& Poor's: Standard & Poor's CreditPro (TM), 1998, Study: 1981-1997, "Summary
of Annual Rating Activities", "Summary of One-Year Rating Transitions".
Tables and Charts

