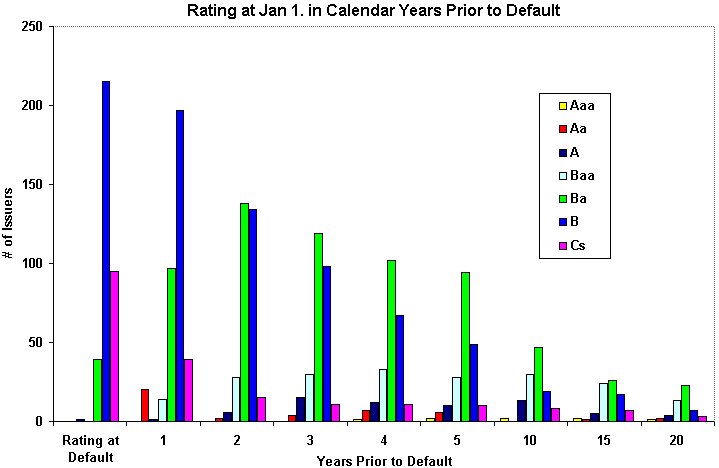
Chart 1: Other

source: Fons, Jerome s., and Kimball, Andrew, June, 1991, "Corporate Bond Defaults and Default Rates 1970-90".
Other
| Table 1: Other | ||||||
US Industrial Long-Term Debt (Three-year, 1994-96, medians) |
||||||
AAA |
AA |
A |
BBB |
BB |
B |
|
EBIT Interest Coverage(x) |
16.05 |
11.06 |
6.26 |
4.11 |
2.27 |
1.18 |
EBITDA Interest Coverage(x) |
20.3 |
14.94 |
8.51 |
6.03 |
3.63 |
2.27 |
Funds from Ops/TotDebt(%) |
116.4 |
72.3 |
47.5 |
34.7 |
18.4 |
10.9 |
Free Operating Cash Flow/TotDebt |
76.8 |
30.5 |
18.8 |
8.4 |
2.4 |
1.2 |
Pretax Return on Capital (%) |
31.5 |
23.6 |
19.5 |
15.1 |
11.9 |
9.1 |
Operating Income/Sales (%) |
24 |
19.2 |
16.1 |
15.4 |
15.1 |
12.6 |
Long-Term Debt/capital (%) |
13.4 |
21.9 |
32.7 |
43.4 |
53.9 |
65.9 |
Total Debt/capitalization (%) |
23.6 |
29.7 |
38.7 |
46.8 |
55.8 |
68.9 |
| Source: Standard Poor's Corporate Ratings Criteria, 1998, "Key Industrial Financial Ratios". | ||||||
| Table 2: Other | ||||||
US Industrial Long-Term Debt (Three-year, (1990-1992) medians) |
||||||
AAA |
AA |
A |
BBB |
BB |
B |
|
Pretax interest cov. (x) |
16.7 |
9.3 |
4.4 |
2.3 |
1.3 |
0.8 |
Pretax interest cov. Incl. Rents(x) |
6.8 |
4.8 |
2.9 |
1.8 |
1.2 |
0.9 |
EBITDA Interest Coverage(x) |
20.1 |
12.7 |
6.4 |
4.0 |
2.4 |
1.5 |
Funds from Ops/TotDebt(%) |
128.5 |
72.7 |
43.1 |
27.7 |
16.1 |
9.2 |
Free Operating Cash Flow/TotDebt |
34.8 |
30.6 |
13.3 |
4.1 |
1.3 |
(1.9) |
Pretax Return on Perm. Capital (%) |
28.2 |
19.2 |
14.9 |
9.8 |
10.0 |
6.1 |
Operating Income/Sales (%) |
21.6 |
16.0 |
13.9 |
12.3 |
10.3 |
9.7 |
Long-Term Debt/capital (%) |
11.1 |
17.0 |
29.7 |
40.4 |
53.0 |
56.8 |
Total Debt/capitalization incl. Short-term debt (%) |
21.9 |
26.4 |
37.2 |
46.5 |
59.7 |
65.9 |
Total Debt/capitalization incl. Short-term debt (incl. 8 times rents) (%) |
33.0 |
37.8 |
48.1 |
58.5 |
72.7 |
75.1 |
source: Standard & Poor's CreditWeek, 10/30/96, "Key Industrial Financial Ratios Show Improvement", p. 90. |
||||||
Chart 1: Other

source: Fons, Jerome s., and Kimball, Andrew,
June, 1991, "Corporate Bond Defaults and Default Rates 1970-90".
| Table 3: Other | |||
Rating Classification of New Issuers vs. Loan Originations |
|||
Rating Classification of New Issuers (1) |
% of Public Debt Outstanding (2) |
||
Investment Grade |
54% |
71% |
|
Non-Investment Grade |
46% |
30% |
|
| source (1): Standard & Poor's CreditPro (TM), 1998, Study: 1981-1997, "Rating Classification of New Issuers". | |||
| source (2): Compustat, 1989-96 | |||
Time to default by rating category |
||||
Standard & Poor |
McDonald |
|||
Original rating |
Defaults(units) |
Avg. Years from original rating |
Defaults (units) |
Mean time to Default |
AAA |
3 |
8 |
||
AA |
8 |
7.6 |
||
A |
23 |
7.6 |
||
BBB |
36 |
6.6 |
||
BB |
147 |
5 |
20 |
6.0 |
B |
233 |
3.7 |
105 |
4.5 |
CCC |
38 |
3.2 |
16 |
3.3 |
Totals |
488 |
4.5 |
||
| source: Standard & Poor's CreditPro (TM), 1998, Study: 1981-1997, "Time to Default by Rating Category". McDonald, Cynthia G., and Van de Gucht, Linda M., July, 1996, "The Default Risk of High-Yield Bonds" . | ||||
Average Contractual Tenor For Private Bank Loans (years) |
|
Chart 3: Other
source: www.FDIC.gov ,The Federal Deposit Insurance
Corporation - Division of Research and Statistics. "Historical Statistics on
Banking".